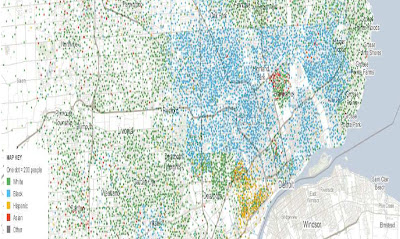
This is a fascinating application that allows you to view the census data by zip code. The picture below is of Detroit and you can see the dramatic racial divide in the city (blue dots =25 black people, green dots =25 white people). Please follow the link and play around with it. From the NY Times and Google
http://projects.nytimes.com/census/2010/explorer?ref=us

No comments:
Post a Comment